
Identifying nifty, bank nifty trends is a very important factor for Indian trader or an investor. A trend is defined as the general direction of a stock price or an assets price. We will learn how to identify the trend in nifty using various methods. There are three major trends in any commodity or stock or an asset that is tradable. They are
- Up-trend(bull market)
- Down-trend(bear market)
- Side way (range bound)
Why is trend important in nifty?
Many traders generally trade with the trend rather than against the trend, as the saying goes “Trend is your friend” so they can profit of the continuation of the trend. Contrarian traders bet against the general trend.
How do you identify a nifty and bank nifty trend?
There are multiples ways to identify the trend of nifty or any particular asset. I will going through a few of them and update this page as I discover more. Do remember that the trend is defined for a particular time frame. A trend can be in a uptrend in weekly charts while at the same time have a downward trend in 5 minute chart. A good trader studies and uses the both long and short term trends to his advantage.
- The most basic and the easiest way to find the trend is noticing the price. An uptrend is defined the the general increase in the price. There will be oscillations from the highest price but the price generally continues increasing. The same way in a downtrend the price continues decreasing with oscillations from their lowest price. This is very basic primitive way of identifying a trend. Example: Real estate prices have been in uptrend in Mumbai.
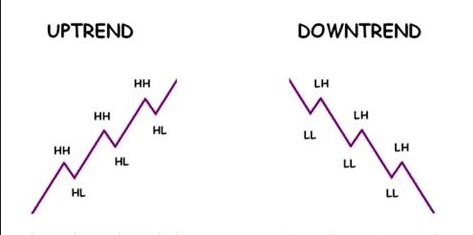
- By looking at charts. A uptrend will make higher high’s (HH) and higher low’s(HL). A downtrend will make lower low’s(LL) and lowers highs. Below is an example of basic trend identification.
- By using moving averages. Moving average is a simple technical indicator that filters out the noise from the price fluctuation. The time frame can be minutes to days when using moving averages, you can even plot multiple moving averages with different time frames in a single chart. Traders generally use crossover methods to enter and exist trade using moving averages. When the price of stock stays above the moving average it is considered to be an uptrend, similarly when the price stays below the moving average it is considered to be in a download