
If you a newbie investor or a trader, you must have probably come across the term “India vix” also known as “nifty vix” and wondered what it probably means? Like the many market terms that is being thrown around in the news and various online communities, India Vix is one of the most important term you should know about. Let’s take a detailed look on what it is.
Table of Contents
What is India vix (Volatility Index) and what does it mean?
India VIX is short for India Volatility Index is calculated and published by NSE( National Stock Exchange). The index was introduced to the Indian market in February of 2008. It is calculated using Nifty index option (Nifty 50) prices and it provides a measure of market volatility to be expected over the next 30 day time period. The nifty index also known as Nifty50 is a benchmark index of the NSE, which represents the performance of 50 most liquid and large capitalized companies listed on the exchange is used as the underlying instrument to calculate India VIX. A detailed report of how it is calculated is given at the end of the post.
Volatility Index as a concept was first introduced globally by Chicago Board Options Exchange. It is based on the S&P 500 index option prices and is known as CBOE Volatility Index. VIX index is also known as fear index or fear gauge. The index has gained popularity over the years as a way of measuring market sentiment and risk. VIX is one of the widely followed indicators used by investors, traders and other market participants to assess the level of uncertainty and risk to before making investment decisions.
India VIX is a measure of market volatility of the Indian market, that is how much a price fluctuates up and down. When prices of stock in nifty index fluctuates a lot like moving up or down drastically you can see index going up, Similarly when the market is more stable and there is not very drastic price changes the Volatility index goes down. India VIX is a good indicator for market volatility over the next 30 day time period.
How to Use India VIX in Trading and Investment Decisions
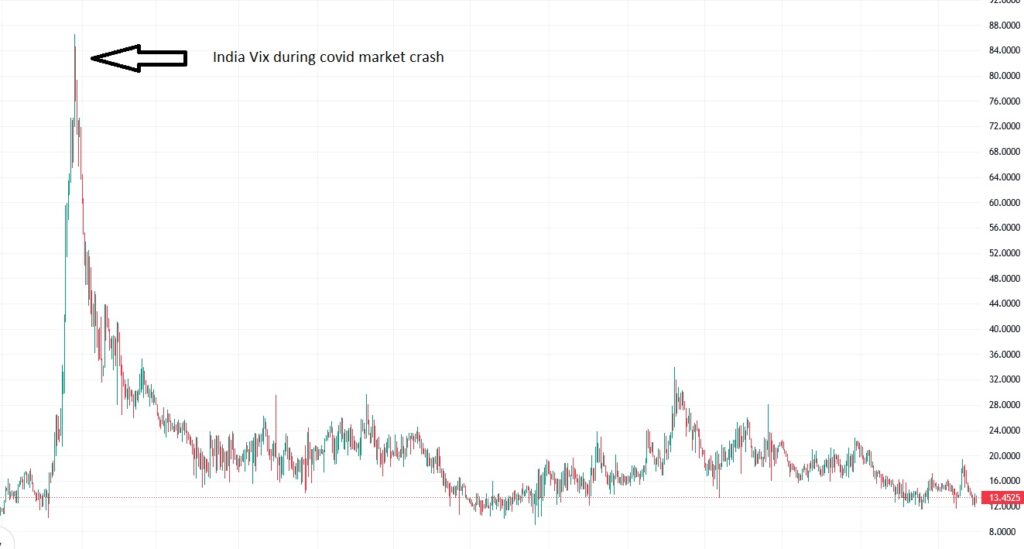
Most of the time, VIX oscillates between 10 and 30, this is considered to be the normal range, some consider 15 to 35. The most common consensus is when the index is below 20, the market volatility is expected to be less. Similarly when it’s is above 20 the market is expected to be volatile. Some market participants consider a higher ceiling of 30 rather than 20. VIX can move even beyond 30. Vix has spiked to 50+ levels during 2009 election when election results were announced and saw two upper circuit moves. India Vix also spiked to 86 levels during the covid market crash.
If you are a long term investor who wants to stay invested for a really long period of time then VIX is a bit meaningless since it is a measure of short term volatility but can be used as an indicator to start hedging your investment which will protect your investments against market volatility.
How is India Vix Calculated
India Vix is computed by using the best bid and ask quotes of the out of the money, present and near month Nifty option contracts. If you are interested in a more in-depth mathematical formula for VIX calculation you can refer here
Explanation in Layman Terms:
Since we have mentioned earlier of how Vix is an indicator of annual market volatility over the next 30 days, lets have a easier way of explaining VIX. For example consider India VIX to be at 20. This means there is an expected annual change of 20% in the nifty over the next 30 days. So we can consider the value of Nifty to trade in a range between +20% and -20% from the current price for the next 1 year for the next 30 days. So if nifty is trading at 18000 then for the next 1 year nifty is expected to trade between 14400(-20% of 18000) and 21600(+20% of 18000).
If you want to know the short term vix, say for example for a 1 month time period, you can use the formula Vix/(√(T)) where T is the time period. Since we are calculating for 1 month and there are 12 months in a year we use Vix/(√(12)) which is 20/3.464 = 5.78%. So the market volatility that can be expected for next one month is 5.78% from 18000. Which is 16959.6(-5.78%) to 19040(+5.78%).
Option Prices and India VIX
The relationship between option prices and India VIX is a very direct one. When VIX is high the option prices (premium) tends to be increase proportionally. Similarly when VIX is low the option prices tend to be lower. Since the risk for an option writer is unlimited they tend to demand higher premiums when the volatility is higher.
In general stock call option tend to rise when VIX rises, while stock put options tend to rise when VIX falls.
Other Uses of India VIX
India VIX is also used in various financial products, including exchange-traded funds (ETFs) and options. VIX-based ETFs and options provide investors with an opportunity to profit off high volatility or hedge against market volatility.
VIX is also used by policy makers to assess the state of the economy and the financial market to make monetary policy decisions.
It is also used in academic research as a tool to understand market behavior and to develop financial models. Academic researchers have used VIX to study the relationship between market volatility and other financial/economic variables such as interest rate, inflation and economic growth.
Key takeaways
- Negative correlation can be seen between India Vix and Nifty. India Vix goes down when nifty goes up. Similarly VIX goes up when nifty falls down.
- It is a forward indicator.
- It is also known as fear index.
- It’s value impacts option premium prices.
- When India VIX is below 15 the market volatility is expected to be low, similarly for a value above 25 the market volatility is expected to be high.
FAQ
What is the Normal Range of Vix?
India vix is usually around 10 to 30. Value below 20 is considered as low volatility and above 20 indicates a higher volatility.
What Happens When Vix is High?
The range between which stock prices trade is expected to widen due to higher volatility.
What Happens When Vix is Low?
The range between which stock prices trade is expected to lessen due to lower volatility. The market conditions are assumed to be stable as the volatility has decreased.